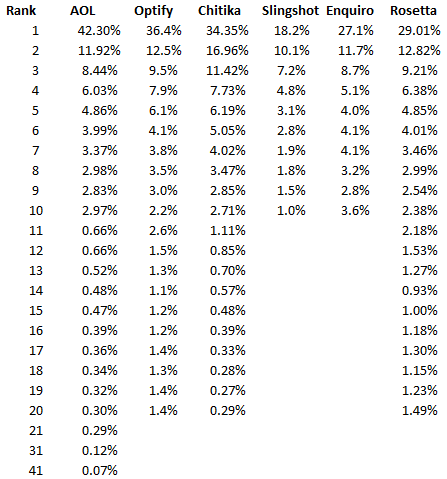
The first publicly available insight into click through rate data was the leaked AOL click through data. Following that, there have been studies and research into click through rates by Chitika, Slingshot, Optify, and Rosetta. All of these yielding different insights into how many people click on each result.

*Note: The Rosetta data is a blend of the data form the other studies
Concerns With The Data
Looking at the data there are some immediate and significant concerns. The first is the lack of consistency while the Optify and Chitika studies and Enquiro and Rosetta studies are close to each other, nothing is really close enough for me to feel like we have arrived at a good CTR that we can use to estimate traffic increases for my clients. That said there are a lot of factors that can have an impact on Google click through rates beyond the simple ranking; a few of these are:
- Influence of brands and branding in the page titles
- Inclusion of Google’s properties/vertical search in the SERPs
- Query intent
- G+ influence and personalized search
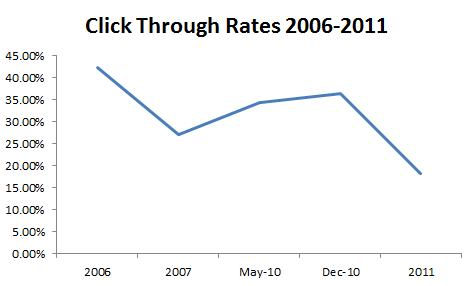
Another concern presented by the data (not with the data itself) is their appears to be a downward trend in the number of people clicking on search results, though this could simply be the final study being erroneous.

Regardless, we don’t have a lot of options if we want to show clients their potential gains. This means it comes down to picking which model you like the most to show your client how much traffic they can gain by improving their rankings.
Sources
AOL Data: http://www.redcardinal.ie/google/12-08-2006/clickthrough-analysis-of-aol-datatgz/
Optify Data: http://www.optify.net/inbound-marketing-resources/new-study-how-the-new-face-of-serps-has-altered-the-ctr-curve
Chitika Data: http://insights.chitika.com/2010/the-value-of-google-result-positioning/
Slingshot Data: http://www.slingshotseo.com/wp-content/uploads/2011/07/Google-vs-Bing-CTR-Study-2012.pdf
Enquiro Data: http://web.archive.org/web/20120131103323/http://www.enquiroresearch.com/campaigns/Business%20to%20Business%20Survey%202007.pdf
Rosetta Data: http://www.rosetta.com/about/thought-leadership/Click-Through-Rate-Establishing-a-Standard-for-SERP-Visibility.html
Geoff, thanks for pulling together this data. I hadn’t seen the Rosetta research yet.
Hopefully this will inspire one of these companies or someone else to capture the data monthly. The trend is just as interesting as the absolute numbers.
Glad you found it helpful. I put the post together because I always have to go dig up the data whenever I want to show the market opportunity – On that note watch out, I’ll be sharing a tool I’m creating pretty soon here to help with that :-)
Hey Geoff. This is a good post. I’ve been digging around for reliable clickthrough data, including some independent studies, but all of their results are completely different. So I’m not sure what to tell the client when they ask about this. I used to always show the AOL study when I first started doing SEO, but now that just doesn’t seem right.
I just read on another blog where a guy had a solid #1 ranking for 30 days and he took the Google Adwords data for estimated traffic and compared it against his actual traffic and he discovered that his #1 ranking was only pulling in 18% of clicks.
From my own experience, I don’t think the data that Google publishes in their keyword tool is totally accurate.
Seems like the only way to get truly accurate number of searches for a specific keyword is to buy a #1 position in Google Adwords for a month. Then you can take the total number of impressions and compare it to your organic click-throughs for the same keyword that (fingers crossed) maintains the same position in the serps for an entire month.
Maybe I’ll try it.
And if you hear anything else about this topic, please share :-)
Hey Mike,
It’s really tough. I think it’s really variable on several different levels, even as basic as the type of query. It’s tough to pick one but I think it depends on the client a bit. If you have someone that’s going to really hold you to the number, stay conservative. If you need to convince someone of the opportunity, pick the large one :) Stay tuned, I should have a post out Monday (maybe Tuesday) with a tool for showing keyword improvement opportunity.
Thanks Geoff, I bookmarked this to keep all the research together. I’ve been using the Optify data for a while to calculate a weighted SERP visibility metric for clients.
Thanks for the summary Geoff. I’ve been using the Optify data for a while to calculate a weighted SERP visibility metric for clients. I’ve always provided the caveat that it isn’t a scientific calculation, but rather a proxy and the relative scores over time are what matter. This round prompts me to revisit the model.
Regarding the apparent downward trend in CTRs, do you think this might be a result of more paid ads and/or the growing use and display of ad extensions like addresses and site links etc? That *feels* likely to me.
Thanks Geoff, I bookmarked this to keep all the research together. I generally err on the side of caution if im taking a search volume and trying to estimate the potential tracking. With so many different variables (shop,images, video, ads,g+) being in the way before SERPs it is very difficult to give decent estimates anymore. I usually just reaffirm the point with a client when showing them their data that these are estimates and that the additional elements in SERPs could alter those numbers.
Super staff. In my opinion you shouldn’t compare this data, beacuse they are made based on different assumptions -> data from certain columns sum up to 100 while other non.
Well since all studies measure the same CTR of SERP, it is not that important what those assumptions were as we’re dealing with estimates anyway, which are (probably) just more accurate than Webmaster Tools data.
As for some columns that end at 10, we can extrapolate other values and get the sum of 100%.
The one thing I don’t get though is why Rosetta value is not the same as average of other values put together. For example, I took 1st position values, divided them by 5 and got 31,67% instead of 29,01%. Anyway, this isn’t a big deal since we can safely assume the error margin should be at least 3%.
I would really love to hear Geoff take on this and other post-February comments. What I don’t love though is the new Geoff’s motorbike picture. Sorry Geoff, but the old one still seen on the comment avatars looks more friendly and welcoming :)
Interesting stats, one thing you can’t be argued is the top two spots generate the lion’s share of the clicks. It’s incredible the difference between position 1 and 10.
Hey Geoff, looks like I’m late to the party here. I was just browsing some CTR stuff in the SERPs when I came across your post. I did notice one thing that I wanted to point out. Some of your data sets are looking at completely different metrics, thus the differences you’re running into.
For example, the Slingshot study looked at how many people came to the SERP then clicked whereas the Chitika data looks at traffic to their ad network and breaks down what positions those clicks came from. Slingshot’s looked at the monthly exact match volume from AdWords and divided that by the total amount of traffic in the month of the study to get the CTR.
I’m not terribly familiar with the other methodologies, but I can imagine they’re similar to Chitika, especially if the %’s add up to 100. Hope that’s helpful.
excellent report thanks!